Overall Equipment Effectiveness (OEE) is one of manufacturing’s most widely used performance metrics. It brings together availability, performance and quality to show how effectively equipment is being utilized.
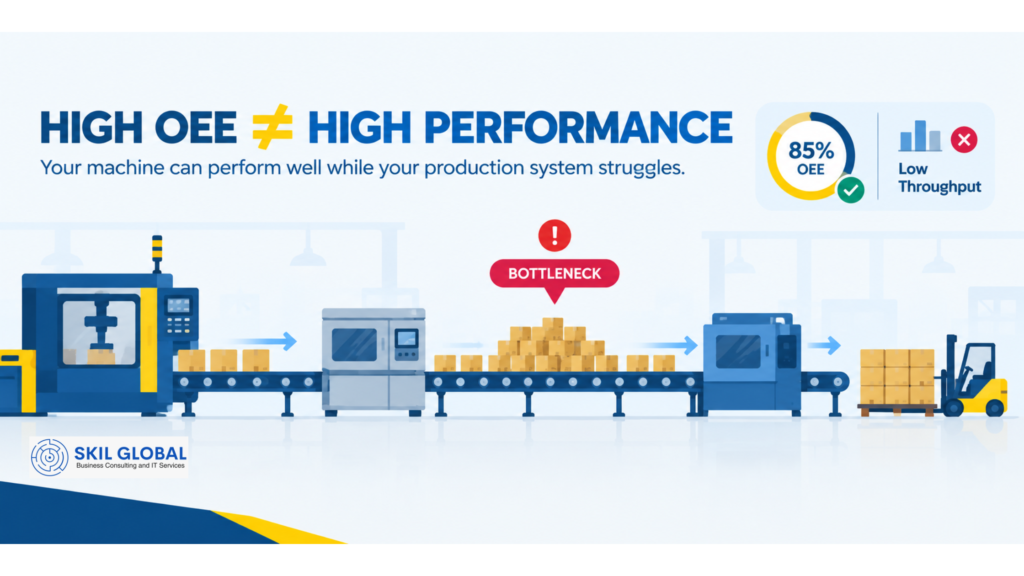
But here’s the problem: a better OEE score does not automatically mean a better production system.
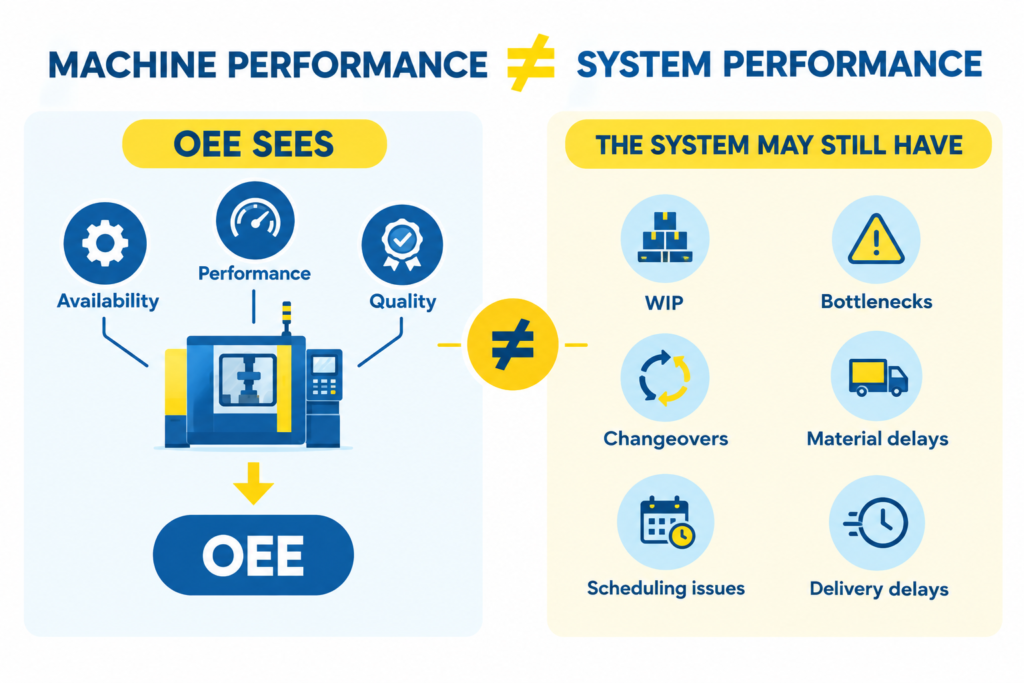
A production line can show strong OEE while still suffering from excessive inventory, long changeovers, material shortages, process bottlenecks and delayed deliveries. When manufacturers focus only on improving the number, they can end up treating the symptom rather than fixing the system.
Discover Where Your Factory Is Losing Capacity
Download the FREE Operational Loss Diagnostic to identify hidden losses across capacity, changeovers, quality, maintenance, and planning—and uncover opportunities to improve productivity and profitability.
Need help custom-configuring ERPNext?
Book a tailored 1-on-1 demo with our ERPNext consultants to see how it fits your specific industry workflows.
The OEE Blind Spot: What the Number Doesn’t Show
OEE tells you how effectively a machine or production asset performed during its planned operating time. What it does not necessarily reveal is why the wider production process is underperforming.
For example, a machine may achieve 85% OEE, but production output may still be constrained by:
- Material waiting times
- Bottlenecks at downstream operations
- Frequent changeovers
- Poor production scheduling
- Excess work-in-progress (WIP)
- Quality issues discovered after production
- Delays caused by approvals or information gaps
Improving machine availability alone will not solve these interconnected issues.
When Optimising OEE Creates Local Improvements
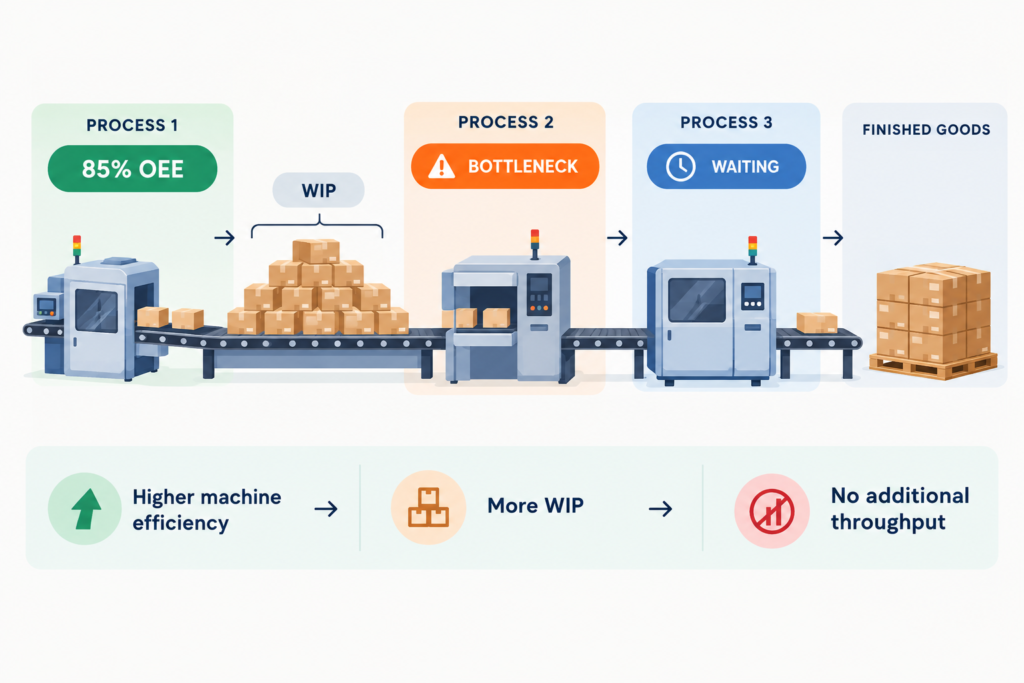
Imagine a packaging machine running at maximum efficiency while the next process cannot handle the output. The result may be more WIP, congestion and hidden waste rather than improved throughput.
This is a common manufacturing challenge: teams optimize individual assets while the overall value stream remains inefficient.
The key question should not only be:
“How can we improve this machine’s OEE?”
It should also be:
“What is preventing the entire production system from delivering more value?”
That requires looking beyond equipment performance.
OEE Needs to Be Connected to the Whole Value Stream
OEE becomes far more powerful when combined with Lean, Six Sigma and Operational Excellence methodologies.
Tools such as Value Stream Mapping (VSM) can identify where material and information are waiting. Root Cause Analysis (RCA) can uncover the real reasons behind recurring downtime. SMED can reduce changeover losses, while DMAIC provides a structured approach to solving persistent performance problems.
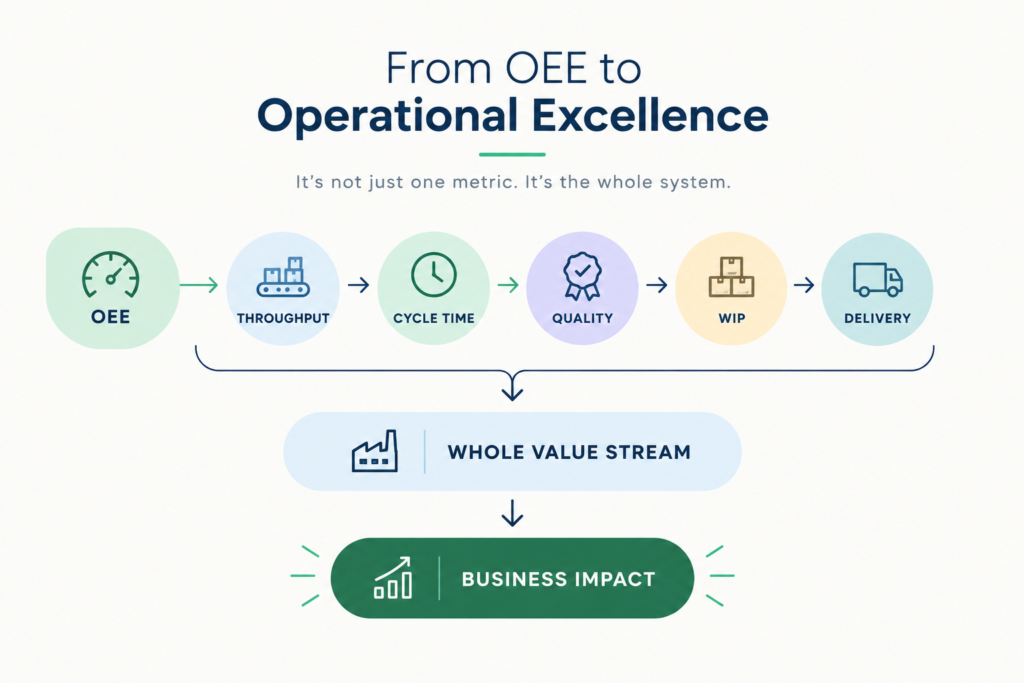
Instead of chasing an OEE target in isolation, manufacturers can connect equipment data with broader measures such as:
- Throughput
- Cycle time
- First-pass yield
- Changeover time
- WIP levels
- On-time delivery
- Cost of poor quality
This creates a clearer picture of where improvement efforts will generate the greatest business impact.
Stop Managing the Metric. Start Improving the System.
OEE is not the problem. Using OEE as the only definition of production performance is.
A machine-level metric cannot, by itself, solve a system-level problem. Sustainable improvement comes from understanding how equipment, people, materials, processes and information interact across the production flow.
The goal should not simply be a higher percentage on a dashboard.
The goal should be more throughput, less waste, better quality and a production system that performs consistently.
Is your OEE improving; but throughput, delivery and profitability aren’t?
SKIL Global helps manufacturers identify the bottlenecks behind the numbers, improve flow and build sustainable Operational Excellence.
Let’s find what your OEE dashboard isn’t showing.
FAQs
OEE measures equipment effectiveness through availability, performance and quality, but it does not independently show whether a machine is the true constraint in the production system. Improving a non-bottleneck can increase WIP without increasing finished output.
OEE measures how effectively equipment performs relative to its potential, while throughput measures the actual volume of output produced over a given period. Manufacturers need both metrics because they answer different operational questions.
Look for the process step that limits the throughput of the overall system. Common indicators include persistent queues or WIP accumulation, high utilization and the lowest effective capacity. OEE measurement is particularly valuable when focused on the true constraint.
Useful complementary metrics include throughput, cycle time, first-pass yield, changeover time, WIP, on-time delivery and cost of poor quality. Together, these provide a broader view of production performance than OEE alone.
Yes. Lean Six Sigma tools such as Value Stream Mapping, Root Cause Analysis, SMED and DMAIC can help identify and reduce the underlying causes of downtime, delays, defects and process bottlenecks rather than simply improving a dashboard metric.