Before you start reading this article on value stream, be sure to check out the first Lean principle! An in-depth understanding of Lean principles is invaluable, as it enables you to implement Lean successfully in the key result areas of a company.
The second Lean principle is mapping the value stream. Let’s outline the steps that you need to follow to become an expert at it:
- Identify the product/service/project you wish to map.
- ‘Walk the process’ between the defined boundaries to capture the current state. To do so, you need to:
– Flow with the product or service as it moves from the first to the last step. Hence, it should be tracked until it is dispatched to the customer. Here are what the steps will look like, based on the subsequent industry:
- Manufacturing – From the raw material receipt to final packaging, and dispatch to customers.
- Services – From logging onto the system to logging out after uploading the finished work.
- IT – From gathering customer requirements to releasing the software application.
Time’s a constraint for me – can I still map the value stream?
Yes! Map the value stream in this way only if time is limited and you have no other option:
- Map the process, and fill the data in the boxes based on the interview.
- Use historical data instead of a live case.
- To make it easy, let’s take a tour of a winding shop (refer to the table below). Write what you see as you walk the process and follow the product.
- The material undergoes various steps, such as transportation, storage, operation, and testing.

Table 1 – Product process chart
- Only two steps are ‘operation’. Of this, only one is a ‘value-added step’. Additionally, it is ‘winding’ – a process step that the customer will pay for!
- In all, there are 9 steps. Out of these, only one adds value or is a transformation step.
- When you look at your work from a ‘Lean’ lens, make sure you define value strictly based on three criteria discussed earlier. Materials witness value addition less than 5% of the time! For the rest of the time, they are moving, stored, inspected, and so on. These 9 steps are the ‘current state’ value stream.
Learn more about creating your current state value stream map!
Why do we need to map it?
To answer this question on value stream mapping, let’s consider an example.
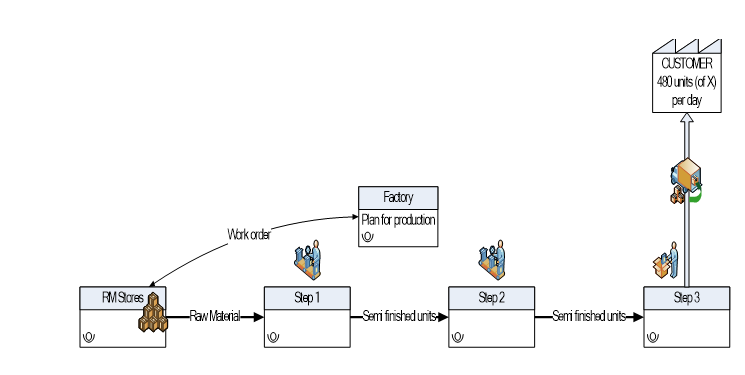
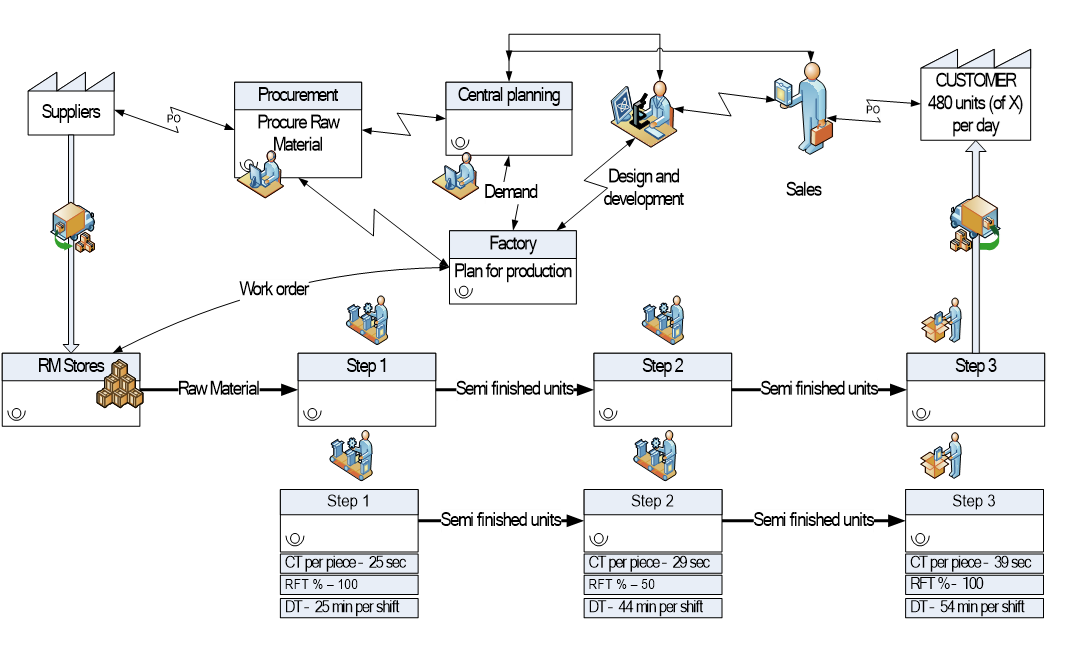
Step 1 of value stream mapping: A customer wants 480 units of ‘X’ each day at 5:30 pm. The customer releases the purchase order to the sales representative.

Step 2 of value stream mapping: The sales representative approves it after analysis. They then hand it over to the Design and Development department.

Step 3 of value stream mapping: The design and development department develops the necessary design documents for bulk production. Then it hands it over for central planning. It also clarifies doubts that the production department may have had. The central planners contact sales representatives to resolve queries associated with shipment schedules. Central planning is responsible for preparing the final delivery schedule. It communicates it with the Factory, where bulk production will take place.

Step 4 of value stream mapping: The purchase team orders the necessary raw materials for production. They discuss the customer orders with central planning and other factory representatives to issue the purchase order to suppliers. Suppliers deliver the necessary raw materials to the factory, according to the plan. The material then reaches the Raw Material (RM) stores.

Step 5 of value stream mapping: At the RM store, the supplies are stored and issued for production against internal work orders. The factory issues the internal work order to start production. There are three steps to produce ‘X’. Production finishes at 5:30 pm, and the finished goods are shipped to the customer.

So, you see how a value stream map involves capturing information and production flow from receiving a customer purchase order to shipping goods to them. Hence, it is a sequence of steps, necessary to meet a customer’s need.
How can I integrate value stream maps with data boxes?
The figure below shows a completed value stream map with data boxes. Data boxes at each step answer questions related to production, quality, and time.

A value stream map
Here’s an example of a data box:
- Needed quantity each day = 480 pieces
- Working hours = 8
- Quantity each hour = 60 pieces
Let’s analyze this situation from the perspective of Lean. One hour is 3600 seconds, so 60 pieces will mean 1 piece should come out every 36 seconds. In the Lean world, these ’36 seconds’ are called the TAKT time – the time element which equals the production rate that meets customer demand. If you stand at the end of the line with a stopwatch and see one unit appear at the end of the line every 36 seconds, the process produces ‘customer demand’.
This leads us to understand the 3rd Lean principle – ‘flow’. Make sure to check out the 4th and 5th steps as well, to ensure that your organization can engage in effective Lean implementation, and help shape the successful future of your company.
