Introduction
In today’s fast-paced warehousing and distribution industry, optimizing operations and maximizing efficiency is paramount. Lean and Six Sigma methodologies offer a powerful framework for achieving these goals, particularly when dealing with the complexities of managing a vast number of SKUs (Stock Keeping Units).
This blog post explores how to conduct a time study for a warehousing company’s 500+ SKUs in just two months, leveraging the combined power of Lean and Six Sigma to release significant capacity.
The Lean Six Sigma Approach
Lean and Six Sigma are complementary methodologies that, when combined, create a robust approach to process improvement. Lean focuses on eliminating waste and maximizing value, while Six Sigma aims to reduce variation and defects.
Warehouses and distribution centers can systematically analyze processes, identify areas for improvement, and implement data-driven solutions by integrating these approaches.
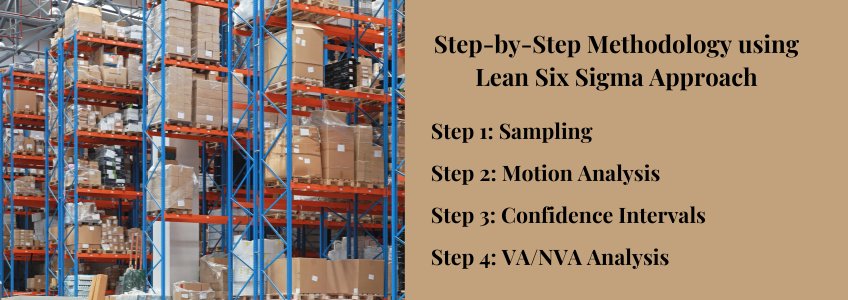
Step-by-Step Methodology

To conduct a time study for 2,000 SKUs efficiently, we can follow a step-by-step approach that leverages key lean and Six Sigma tools:
Step 1: Sampling
For a warehousing company with a large number of SKUs, studying each one individually would be time-consuming and impractical. We can select a representative subset of SKUs, by employing statistical sampling techniques, that accurately reflects the characteristics of the entire population.
This allows us to gather meaningful data while minimizing the time and resources required. The feasible sample size of 30 was suggested statistically. If not we used the concepts of motion analysis to establish elemental time standards
Step 2: Motion Analysis
Once the sample SKUs are identified, we can conduct a detailed motion analysis to break down the processes involved in handling each SKU. We can identify bottlenecks, redundancies, and areas for improvement by observing and documenting the movements of warehouse workers.
Lean tools such as spaghetti diagrams and value stream mapping can be used to visualize the flow of materials and information, highlighting opportunities for streamlining. Hand motion elemental analysis was done in this regard.
Step 3: Confidence Intervals
To ensure the reliability of our findings, we can calculate confidence intervals for the measured sample cycle times. We can make informed decisions based on a high level of statistical confidence by determining the range within which the true cycle time is likely to fall.
Six Sigma tools like hypothesis testing and analysis of variance (ANOVA) can be employed to validate the significance of our results. The 95% confidence interval for the cycle time per part was used to derive the time standards agreeable to warehouse team.
Step 4: VA/NVA Analysis
Distinguishing between value-added (VA) and non-value-added (NVA) activities is a fundamental principle of lean thinking. The NVA motion and time elements were identified and excluded as part of time standard in consensus wit stakeholders.
We can identify opportunities to eliminate waste and optimize the process. This can be done by categorizing the motions and steps involved in handling each SKU as either VA or NVA. This analysis helps us focus our improvement efforts on the activities that truly contribute to customer value.
Application Example

Let’s consider a real-world scenario where a distribution center needs to conduct a time study for 500+ SKUs to identify opportunities for capacity release. The team can efficiently tackle this challenge by applying the lean Six Sigma approach, :
- They begin by selecting a statistically significant sample of 200 SKUs that represent the diverse characteristics of the entire SKU population.
- The team then conducts motion analysis on the sample SKUs, documenting the movements of warehouse workers and identifying areas for improvement. They create spaghetti diagrams to visualize the flow of materials and highlight unnecessary movements.
- Using statistical tools, they calculate confidence intervals for the measured cycle times. This ensures a high level of reliability in their findings.
- Through VA/NVA analysis, the team identifies that 30% of the motions involved in handling the SKUs are non-value-added. These include excessive walking or searching for materials.
- The key aspect of time study was, walk time, picking time, kitting time and movement time. Walk and movement time was simplified by the design of picking trolleys, combined kitting and picking and rearranging products in racks.
- Based on these insights, the team implemented targeted improvements. These improvements included optimizing the layout of the warehouse, streamlining processes, and providing training to warehouse workers.
Results and Conclusion
The distribution center successfully completed the time study for 2,000 SKUs within the two-month timeframe, by leveraging the power of lean Six Sigma. The insights gained from the study enabled them to implement targeted improvements that release 25% of their manpower resource. The lead time to kitting is also reduced by 70%, allowing them to handle increased throughput without additional resources.
The combination of lean and Six Sigma proves to be a potent approach for tackling complex challenges like conducting a time study for a large number of SKUs in the warehousing and distribution sector.
Therefore, by embracing the above-mentioned methodologies, warehouses and distribution centers can unlock hidden capacity. They can also improve their customer satisfaction and gain a competitive edge in the industry.
If you are interested in achieving similar success stories, write to us!
