
The Problem No One Escalates
There’s a familiar pattern in most pharma plants. You close the month, review performance, and nothing is technically wrong. Batches are released, compliance is intact, and audits are clean.
And yet, the numbers don’t feel right. Output per shift is lower than it should be, costs are slightly elevated, and there’s always a quiet pressure to “push a little more” next month.
No deviation explains it. No breakdown justifies it.
This is not a failure problem. It’s a visibility problem.
A Line That Looks Stable (But Isn’t)
Consider a blister line running a standard tablet with 250-micron PVC/PVDC film and aluminum foil lidding.
Rated speed: 300 blisters per minute
Actual operating band: 230–240
No alarms. No escalation.
If you translate that gap:
- ~60 blisters/min lost
- ~30,000 blisters per shift
- ~8–9 lakh per month
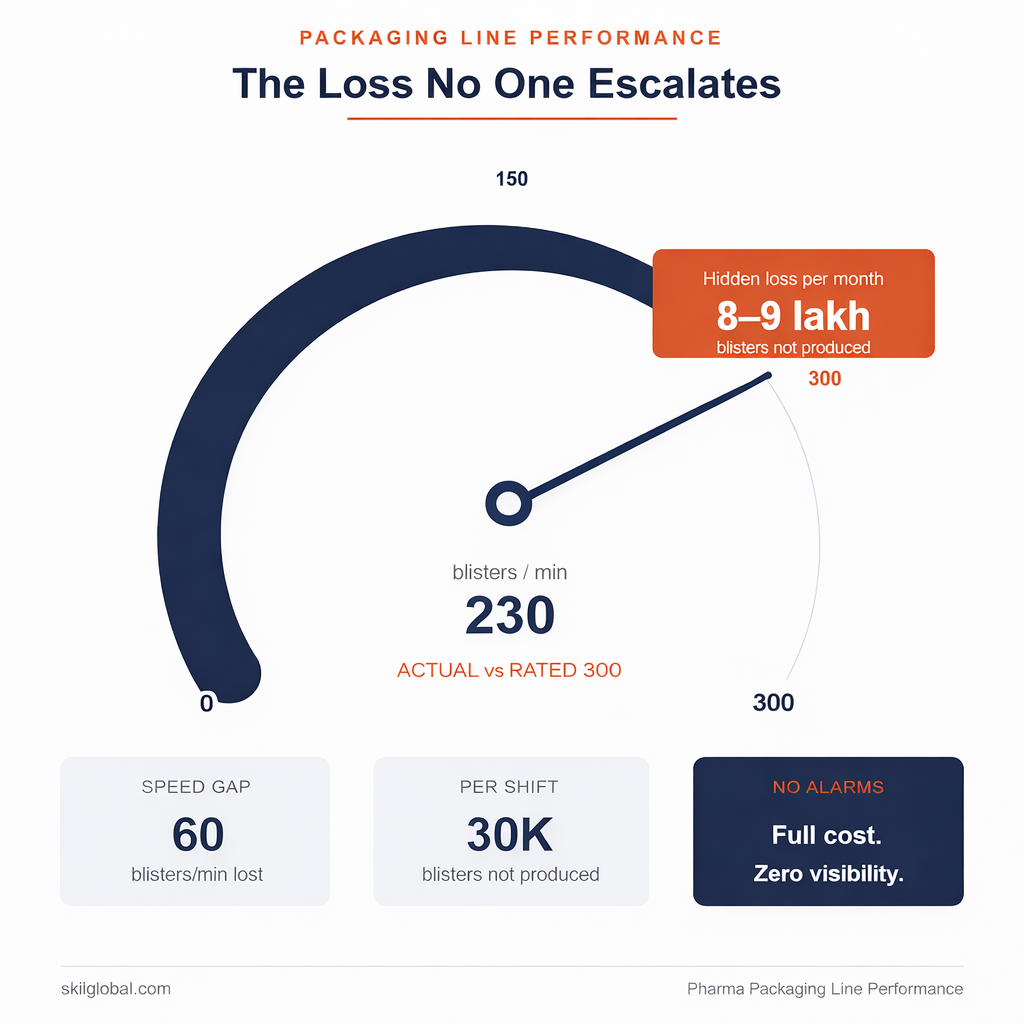
You are not running below speed; you are running below capacity—with full cost attached. Many plants find that optimizing pharmaceutical operations starts with reclaiming this invisible throughput.
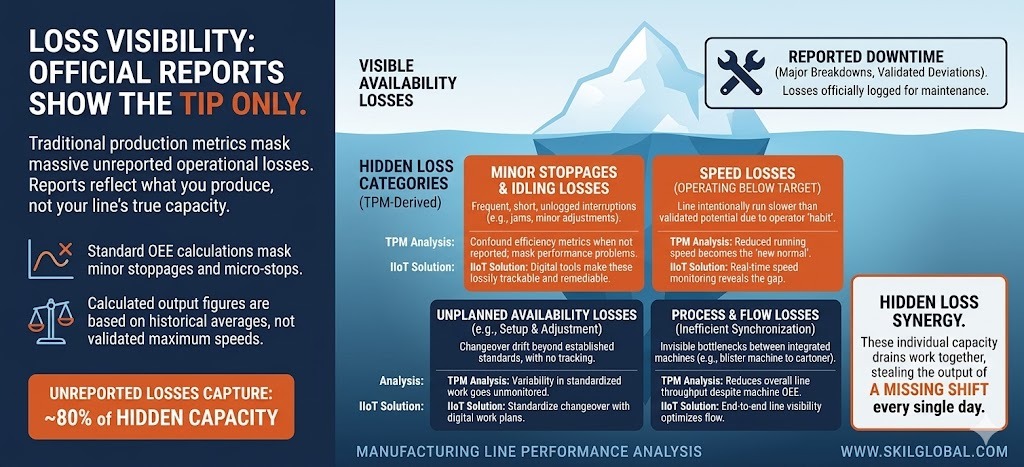
Where the Loss Actually Lives
The loss is not where reports point. It sits in the small, repeated events that never become “problems.”
A foil misfeed that pauses the machine for 20 seconds. A minor forming issue. A quick sensor correction. None of these trigger attention individually, but together they quietly consume a significant portion of productive time.
Then comes speed—rarely questioned, almost always accepted. Operators settle into a range where the line feels stable, and over time, that range becomes the default. It stops being a decision and becomes a habit.
One plant had a night shift that consistently ran at ~80% speed. There was no formal instruction—just an understanding that it was “safer.” The line never failed, but it never performed either. That gap existed every night, completely invisible in reports.
If a machine hasn’t been tested under controlled conditions at higher speeds, the operating limit is not technical—it’s assumed. This often conflicts with the FDA’s guidance on process validation, which encourages a lifecycle approach to understanding process capability.
What Is Really Driving the Loss (Look Here First)
Instead of spreading attention everywhere, most plants will find the majority of loss concentrated in a few areas:
- Micro-stoppages that are too small to log but too frequent to ignore
- Operator-defined speed limits based on comfort, not validation
- Changeovers that stretch beyond standard without visibility
- Flow imbalance between blister, cartoner, and downstream units
These don’t look like major issues individually.
But together, they behave like a missing shift.
Why It Stays Hidden
The systems are not designed to expose this.
OEE smooths over short interruptions, making a line appear stable even when it sits well below industry benchmarks for OEE.
So the line appears stable.
And stability, in most plants, is rarely challenged.
What Changes When You Shift the Lens
The breakthrough doesn’t come from more data—it comes from reframing what you measure using advanced problem-solving frameworks like Lean Six Sigma to link patterns to performance.
- Instead of asking “What was the downtime?” → ask “How many blisters did we not produce?”
- Instead of accepting speed → ask “Why this speed and not higher?”
- Instead of reviewing batches → compare shift-to-shift behavior
In one pharma plant, this shift exposed nearly 40% hidden loss on a line that had no major issues. There was no single fix. The gains came from connecting patterns—micro-stops, speed habits, and changeover drift—and treating them as one system.
The equipment didn’t change.
The discipline did.
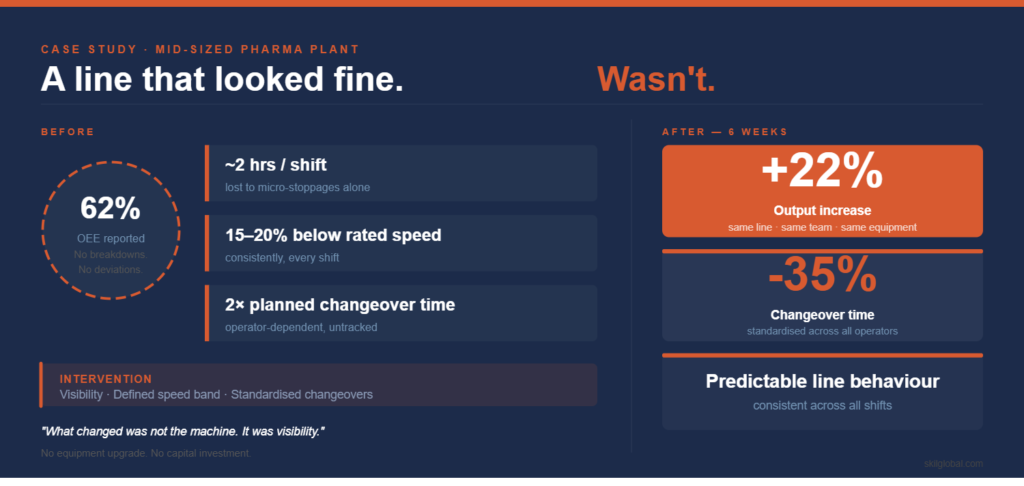
What This Looks Like in Reality (A Quick Case)
A mid-sized pharma plant we worked with had a blister line that, by all internal measures, was “stable.”
- OEE was reported at ~62%
- No major breakdown trends
- No recurring deviations
From a review standpoint, there was nothing urgent to fix.
But when we observed the line over a few shifts and translated losses into output instead of percentages, a different picture emerged:
- Minor-stoppages alone were consuming close to 2 hours per shift
- The line was consistently running 15–20% below rated speed
- Changeovers were taking almost double the planned time, varying by operator
None of these were new problems.
They were just never viewed together.
Once they were:
- Micro-stoppages were tracked and reduced through simple interventions
- A defined operating speed band was established (not left to operator comfort)
- Changeover steps were standardized and timed
There was no equipment upgrade. No major investment.
Within six weeks:
- Output increased by ~20–22%
- Changeover time dropped by ~30–35%
- The line behavior became predictable across shifts
What changed was not the machine.
It was visibility—and the discipline that followed it.
How we record those “Minor Stoppages” losses
Moving from guesswork to digital precision:
- The “Reverse Math” Trap: Traditionally, minor stops aren’t measured—they are “found.” Managers subtract reported big breakdowns from total time and assume the remainder is the loss. It’s like trying to find a leak by looking at a high water bill instead of finding the hole in the pipe.
- The Fog of Confusion: When stops aren’t reported, they get “confounded” or mixed up with performance losses. You can’t tell if the line is running slow or if it’s stopping and starting 100 times an hour. As the saying goes, “What stays hidden, stays broken.”
- The Emotional Toll of Guessing: Without clear data, plant floor discussions become “he-said, she-said” arguments. Supervisors feel the heat for low numbers, but they lack the evidence to show where the time actually went.
- The IIoT Solution: With IIoT sensors, the “invisible” becomes “trackable.” Technology monitors the machine’s heartbeat in real-time, capturing every 10-second micro-stop that a human would miss.
- Total Transparency: Digital tracking removes the bias. You no longer have to “reverse calculate” your efficiency; you see the exact reality of your shop floor, making it impossible for losses to hide in the shadows of your P&L.
“In God we trust; all others must bring data.” — W. Edwards Deming
Before You Add Capacity
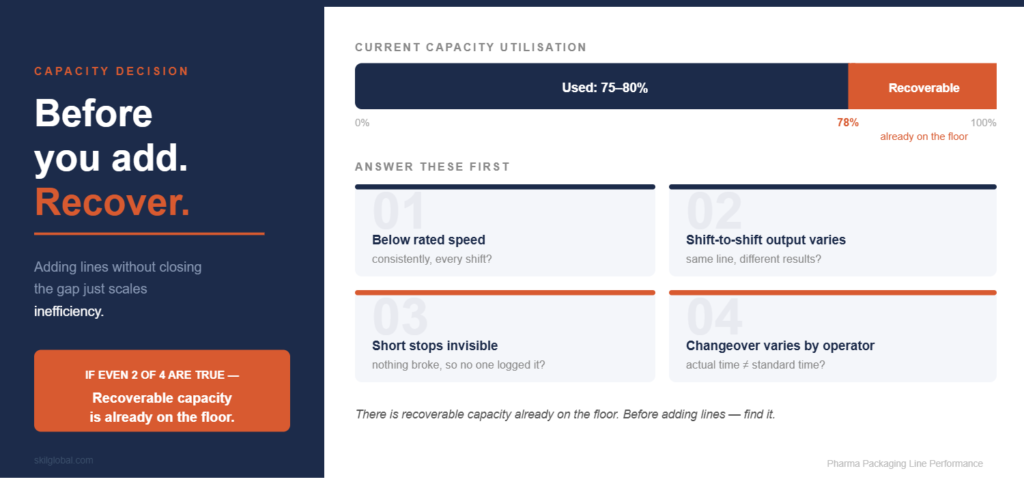
Most decisions at this stage lean toward expansion—new lines, automation, additional shifts.
But if your current line is operating at 75–80% of its true capability, then adding capacity without fixing that gap simply scales inefficiency.
A more useful starting point is simpler:
- Are we consistently running below rated speed?
- Do different shifts produce different outputs on the same line?
- Are short stops visible—or ignored?
- Does our actual changeover match the standard?
If even two of these are inconsistent,
there is recoverable capacity already on the floor.
Closing Thought
In pharma, we are excellent at preventing failure.
But efficiency doesn’t fail loudly.
It erodes quietly—through small compromises, safe assumptions, and unchallenged habits.
And once that erosion becomes normal, it stops being questioned.
A Practical Next Step
Before investing in more machines or more shifts, it’s worth understanding what your current line is truly delivering.
The Packaging Line Self-Diagnostic is designed to make that visible—quickly and without disruption. It helps translate everyday line behavior into measurable capacity loss so you can see where the real opportunity lies.
Not as a solution.
But as a way to answer one critical question:
How much of your line are you actually using—and how much are you paying for without getting?