
Your plant looks active. But is it effective?
Walk into any FMCG plant and you’ll see motion everywhere.
Lines are running. Operators are engaged. Supervisors are firefighting. Dispatch targets are being chased.
On the surface, everything looks active.
But if you step back and ask a harder question —
“Are we truly running at full capacity?”
That’s where things change.
Because most plants are not.
In fact, many are quietly losing 20–30% of their real capacity without realizing it.

Not because teams aren’t working hard.
But because the losses are buried inside what everyone has accepted as normal.
And in manufacturing, normal is often the biggest barrier to improvement.
The FMCG reality: high speed, hidden loss
Take a typical high-speed packaging line.
It’s designed for 300 units per minute. On paper, it occasionally hits that number. But across a full shift, it settles closer to 240–250.
Nothing is “broken.”
Just:
- A minor jam
- A quick reset
- A slightly longer changeover
- A bit of yield erosion
No alarms. No escalation.
But here’s what usually gets missed:
These are not isolated events. They are chronic minor stoppages and small inefficiencies that accumulate over the shift.
And most of them never show up correctly in reports.
The data problem no one talks about
From a Plant Head’s perspective, one reality is hard to ignore:
The data is not always telling the full story.
Manual logbooks tend to smooth things out.
It’s easier to report:
- One 30-minute breakdown
…than:
- Sixty 30-second stops
So what looks like a stable line on a dashboard often hides a very different shopfloor reality.
This is one of the biggest reasons why nearly 80% of losses remain invisible to leadership.
Where capacity actually leaks (and why it feels “normal”)
Capacity loss rarely comes from one big issue.
It comes from patterns that have been normalized over time.
Machines don’t consistently run at rated speed. Changeovers depend on who is running the shift. Yield erosion is accepted within a “tolerance range.” Maintenance doesn’t fail dramatically — it creates just enough instability to disrupt flow. And sometimes, the line is simply waiting — for material, approvals, or decisions.
Over time, teams adapt to this.
Workarounds become habits.
Habits become standards.
Standards become “this is how the plant runs.”
And that’s how 15–35% capacity quietly disappears.
Our framework for identifying and eliminating systemic capacity leaks is designed to break this cycle by highlighting the gap between “standard” performance and “theoretical” maximums.
This is not an efficiency issue. It’s a margin issue.
Most conversations stay at OEE.
But at a Plant Head level, the real question is:
“What is this costing me?”
When translated into financial terms:
- A single FMCG line can lose ₹50 lakhs to ₹3 crores annually
- A multi-line plant can be sitting on a ₹5–15 crore opportunity
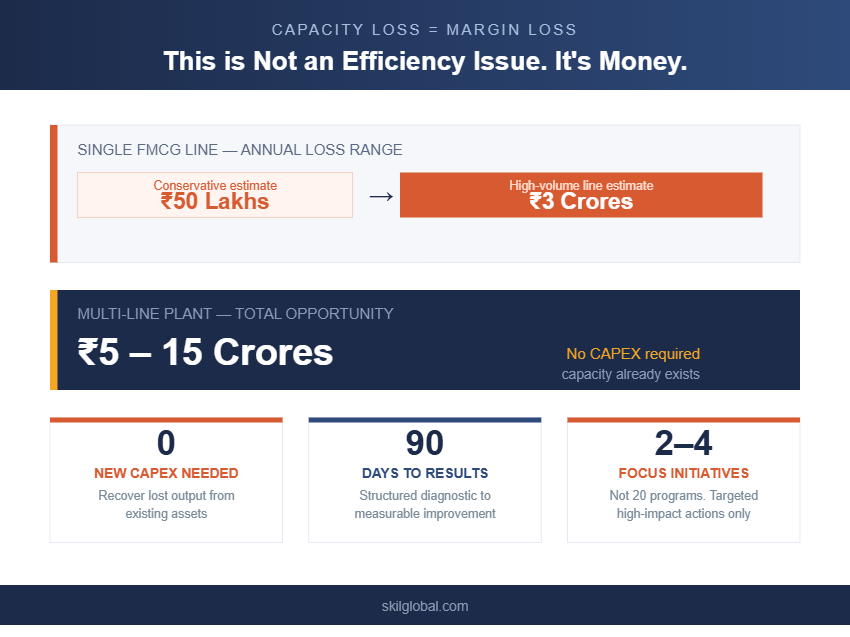
That’s not inefficiency.
That’s margin leakage.
And the critical part:
- This is capacity you already have.
- No capex required.
Why most improvement efforts don’t sustain
Most plants are not ignoring these issues.
They’ve already tried to improve them.
Lean programs. OEE dashboards. Kaizen events.
But the same problems keep resurfacing.
Because the issue is not intent — it’s approach.
Improvement efforts often:
- Focus on visible problems instead of high-impact ones
- Start execution before fully quantifying losses
- Track activity but not financial outcomes
Which leads to a familiar cycle:
Initial improvement → temporary gain → gradual slip → back to baseline
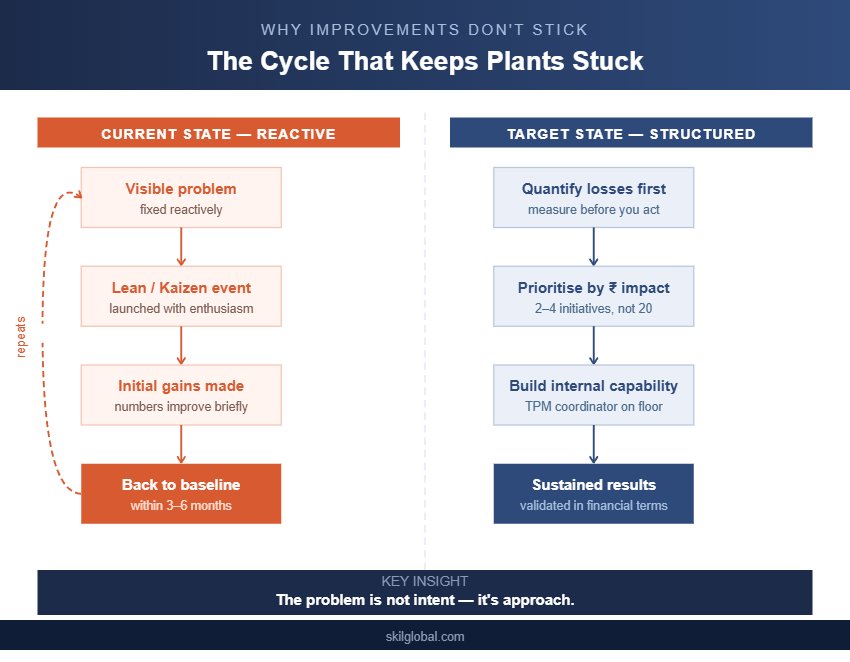
Building internal expertise through a TPM Coordinator Program is critical for breaking this cycle. It moves the responsibility of “hidden losses” from a static management dashboard back to a trained leader on the shop floor.
Without this internal capability to lead and sustain the change, improvements often feel real during a workshop but don’t move the needle at the plant level over the long term.
The real shift: from dashboards to Gemba
This is where the approach needs to change.
Not more dashboards.
More reality.
Because most losses are not sitting in Excel sheets.
They are happening:
- Between cycles
- During changeovers
- In operator adjustments
- In micro-stoppages that never get recorded
This is why a proper diagnostic doesn’t just analyze data.
It validates it on the shop floor.
It challenges what is reported… with what is actually happening.
And that’s where the real insights come from.
The FMCG reality: high speed, hidden loss
Take a typical high-speed packaging line. It’s designed for 300 units per minute. On paper, it occasionally hits that number. But across a full shift, it settles closer to 240–250. Nothing is “broken.” Just a minor jam, a quick reset, a slightly longer changeover, or a bit of yield erosion. No alarms. No escalation.
But here’s what usually gets missed: these are not isolated events. They are chronic minor stoppages and small inefficiencies that accumulate over the shift.
Image 4
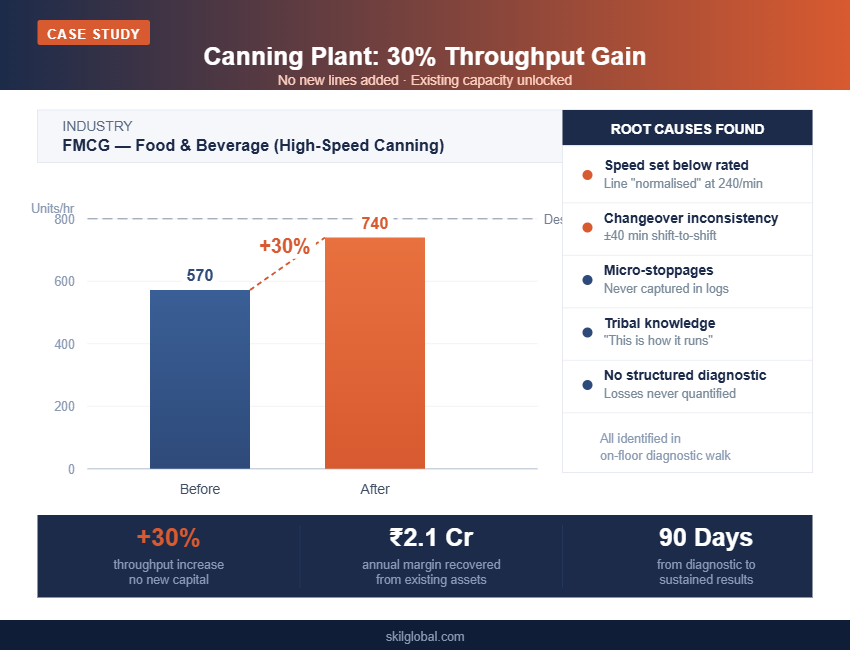
Most of these losses never show up correctly in reports because the “normal” speed is often set to match current struggles, not true potential.
The human side of the problem
One reality every Plant Head understands:
These losses are rarely just technical.
They are cultural.
“This is how Machine 4 behaves.”
“This is the best we can do in this setup.”
“This is already optimized.”
Over time, these beliefs become embedded.
Which is why any serious improvement effort has to:
- Respect shopfloor experience
- Validate assumptions
- Replace “tribal knowledge” with data-backed clarity
Without turning the exercise into a policing activity.
Before fixing anything—get clarity first
The biggest mistake plants make is starting with solutions.
Instead of starting with clarity.
Because unless losses are:
- Clearly identified
- Properly measured
- Financially understood
…prioritization becomes guesswork.
And guesswork rarely delivers sustained results.
Download: Where Is Your Plant Losing 20–30% Capacity? (Self-Assessment Guide)
If you’re seeing this pattern in your plant, the next question is not execution yet.
It’s clarity:
“Where exactly are we losing capacity — and how much is it costing us?”
This diagnostic guide helps you answer that.
Inside the guide:
- A structured self-assessment to identify hidden losses
- The 5 key loss categories (capacity, changeover, quality, maintenance, planning)
- A simple scoring model to assess your operational maturity
- Benchmarks to understand where you stand vs potential
- A framework to estimate the ₹ impact of your losses
It’s designed for plant leaders who want clarity before action.
Final thought
Most plants are not short on effort.
They are short on visibility.
Because when losses are hidden, improvement becomes reactive.
And when improvement is reactive, results don’t sustain.
Or simply:
If you cannot quantify your losses, you cannot improve them.
If you want to know where your capacity is going
The first step is not another internal review.
It’s a structured, low-disruption diagnostic.
One that:
- Does not slow down your lines
- Does not overload your supervisors
- But gives you clear, quantified insight
In a short discussion, you can:
- Identify your top hidden losses
- Estimate their ₹ impact
- Understand where to focus first
Book a Diagnostic Call
If your plant is running but not reaching its true potential, this is where you start.
Unlock what you already have.