The Problem of “Accepted” Inefficiency
Most plants don’t lose capacity due to breakdowns.
They lose it during changeovers — every single day.
In many FMCG plants, changeovers are treated as a fixed cost of doing business. As SKU complexity increases and cleaning requirements get stricter, teams simply accept that “changeovers take time.”
Over time, changeover duration becomes a planning assumption — not a performance variable.
Even when improvement efforts reduce time temporarily, they rarely sustain.
And the line quietly loses capacity.
What This Looks Like in Real Operations
Consider a high-speed bottling line. On paper, the schedule was optimized.
In reality:
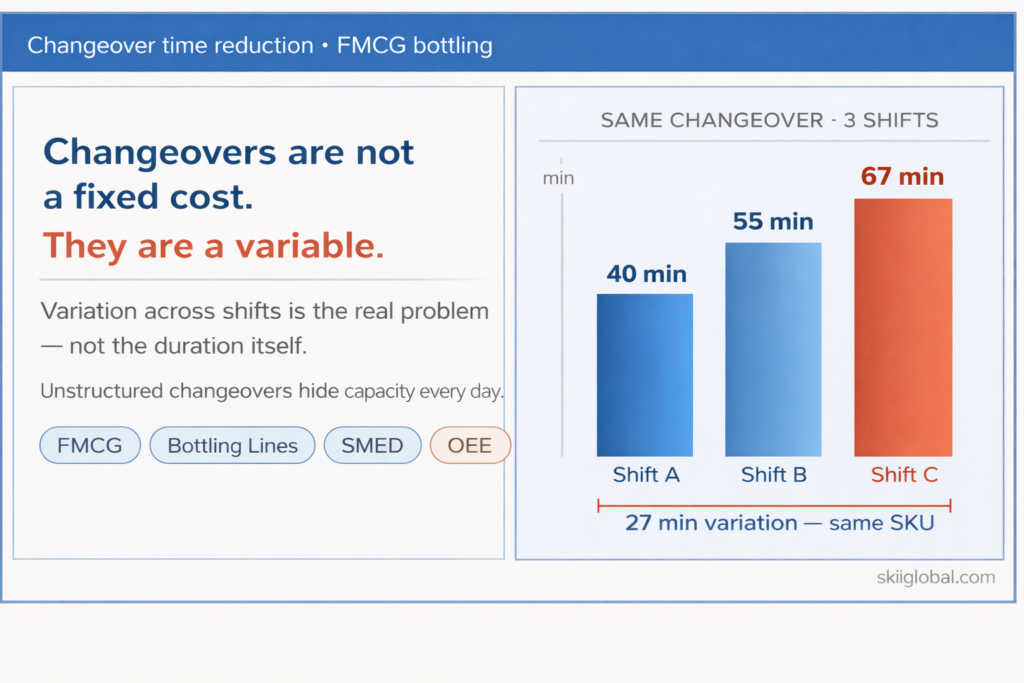
- Variation: Changeover times varied by 20–30% across shifts
- The Buffer Trap: Planners added extra time just to stay on track
- The Outcome: The line was running — but not predictable
In FMCG environments, the loss is not just downtime —
it is the variation that disrupts planning and output stability.
Where the Real Loss Happens
Changeover inefficiency is not always visible. It hides inside execution gaps.
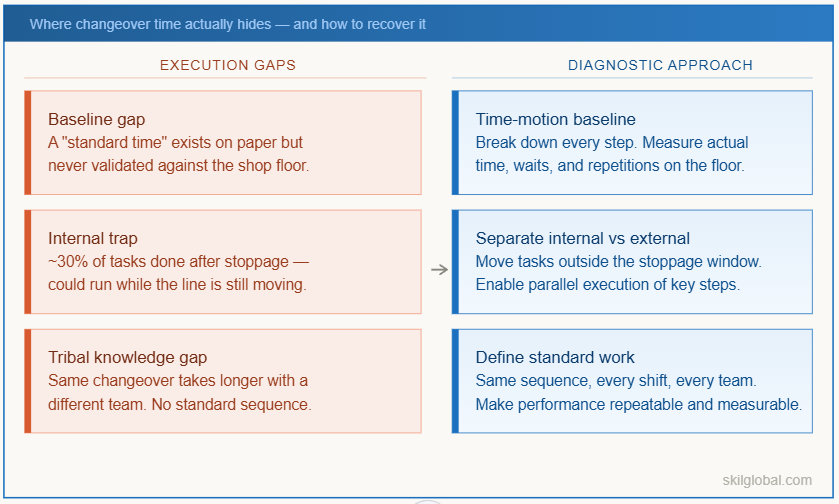
The Baseline Gap
A “standard time” exists — but hasn’t been validated against actual shopfloor conditions.
The Internal Trap
~30% of tasks are still performed after stoppage, even though they could be completed while the line is running.
The Tribal Knowledge Gap
Performance depends on experience. The same changeover takes longer when a different team executes it.
The result:
👉 Hidden capacity loss
👉 Unreliable production schedules
👉 Missed output without visible breakdowns
What Changes When You Diagnose the Process
A diagnostic approach does not start with reducing time.
It starts with understanding where time is actually going.
The focus shifts to:
- Breaking down each step of the changeover
- Identifying delays, waits, and repetitions
- Separating internal vs external activities
- Tracking variation across shifts
What appears as one long activity becomes multiple improvement opportunities.
Most fixes are not complex.
They are:
👉 Better sequencing
👉 Parallel execution
👉 Standardized steps
What Happened When the Approach Shifted
Result: ~50% reduction in changeover time
This example is based on an actual engagement executed by our team in a brewery bottling plant.
Initial observations showed:
Changeovers were inconsistent, with no clear visibility into delays
A structured diagnostic revealed:
- Significant waiting time between steps
- Activities that could be externalized
- No standard sequence across teams
The actions were focused and practical:
- Time-motion study to baseline each step
- Separation of internal vs external activities
- Parallel execution of key steps
- Standard work defined for every changeover
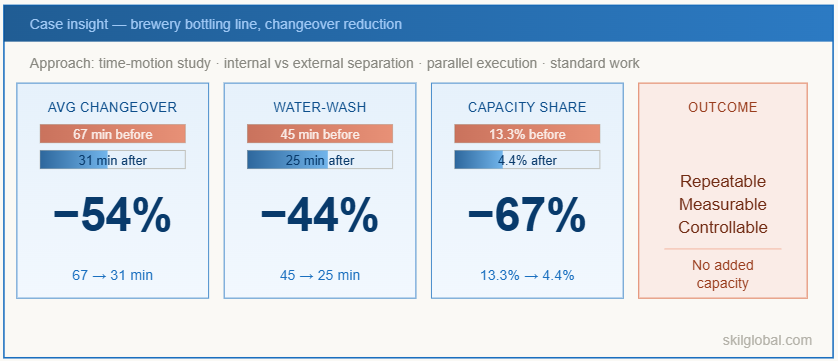
The impact was clear:
- Average changeover time reduced from 67 min → 31 min
- Water-wash changeover reduced from 45 min → 25 min
- Changeover time reduced from 13.3% → 4.4% of available time
This directly translated into:
👉 Higher available production time
👉 More predictable schedules
👉 Increased output without additional capacity
More importantly, changeovers became:
Repeatable, measurable, and controllable
The Question That Matters Now
Most plants don’t struggle because changeovers are long.
They struggle because changeovers are not structured, measured, or standardized.
If your changeover time varies across shifts,
or feels “optimized but still high” —
you are likely sitting on hidden capacity.
Over a month, this gap can translate into hours of lost production time — without a single breakdown being reported.
What You Can Do Next
1. See Where You’re Losing Time (Free Tool)
Evaluate your visibility, sequencing, and execution gaps using our self-assessment.
Download the Operational Excellence Diagnostic Checklist
2. Turn Insights into Action
If you want to identify specific improvement opportunities in your plant:
Book a 20-minute Diagnostic Call