After understanding their interrelationship and required steps, it is important to look into calculating takt time, line balance, and flow. Hence, you should know the following formulas:
- Takt time = Operating hours per day / Output demand per day
- Output demand per day = Output demand per month / Operating days per month
Applicability of calculating takt time, line balance, and flow:
For instance, let us take 30,000 units that need to be produced in a month.
Table 1 – Current state data

There are 20 working days in a month. Hence, 1500 units must be made each day. If there are 480 minutes (28,000 seconds) of operation in an 8-hour day, then each unit must be produced in:
28,000/15000 = 19.2 seconds.
Therefore, the takt time is one every 19.2 seconds.
Here’s a 5-step process with the current state data:
- Total cycle time = 50 + 10 + 45 + 30 + 65 = 200 seconds.
- Number of operators needed = 200/19.2 = 10.4 (or round it off to 11). Note that compared to the current state there are 10).
How do you calculate the number of operators, assuming that no change or improvement takes place in any step?
- Step 1: Cycle time / Takt time = 50/19.2 = 2.6
- Similarly, for the other steps, the number of operators needed are:
10/19.2 = 0.52; 45/19.2 = 2.34; 30/19.2 = 1.56; 65/19.2 = 3.38. Hence, these sum up to 10.4.

However, the team should first strive to reduce the cycle time at each step. 3 very important questions should be addressed at this stage:
- Firstly, how can cycle time be reduced? – By reducing wastes.
- Secondly, what are the processes to reduce waste? – Kaizens
- Thirdly, what changes are necessary to reduce the cycle time? – To answer this question, let’s take a look at the following steps:
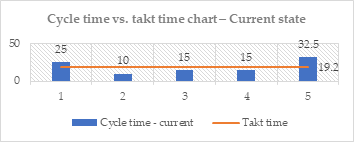
3. In this step, we need to bring our focus to the cycle time versus takt time chart. I am using operators in the ‘current state’. If 2 operators are used in step 1 with 50 seconds cycle time, we produce units every 50 seconds (or 1/25). Therefore, takt is 1/19.2.
Similarly, let’s do a cycle time versus takt time chart for all the steps:

Figure 1 – Cycle time vs. takt time graph
- Step 1 and 5 exceed the takt time. Let’s compare number operators – the current state versus the desired state (with no change or improvement). Revised operators are shown in the table below.
Table 2 – Operators calculated based on takt and cycle time

- Carry out Kaizen at step 1 and 5 to reduce cycle time! Try to bring the cycle time bar closer or below the takt time’s line of 19.2 seconds. Bringing them close to each other is indicative of a balanced process.
