Using data analytics to discover, the growth path offered by a company to its employees
Practical scenario
Why is attrition so high? “We don’t offer the best pay scale to them”, was the response in a ‘flash’, from one of the HR representatives. Don’t you give performance incentives? – “We do, but the new recruits go by what they clear on hand – to begin with”. Ideally, if you are giving incentives, then they should be earning equal to or more than what others are offering around, “please get me the data I need, let the data decide – If you have anything special, that will attract talent”, I said. Do you offer a good growth path to them? I asked. “There are some people who earn more than Rs.20,000 a month”, was the response, “but the minimum wages you mentioned, is a third of that! I said… never mind, let’s do the analysis.
Statistical scenario
What is the average gross income? How is the gross income distributed? Do workers earn more over time, with improved skills on the job? Is there a correlation between tenure and earning, given bulk of the salary comes from performance incentives? A good case to use correlation analysis followed by regression analysis. But first let’s apply basic statistics to analyze gross income distribution.
Statistical analysis
Basic statistical analysis
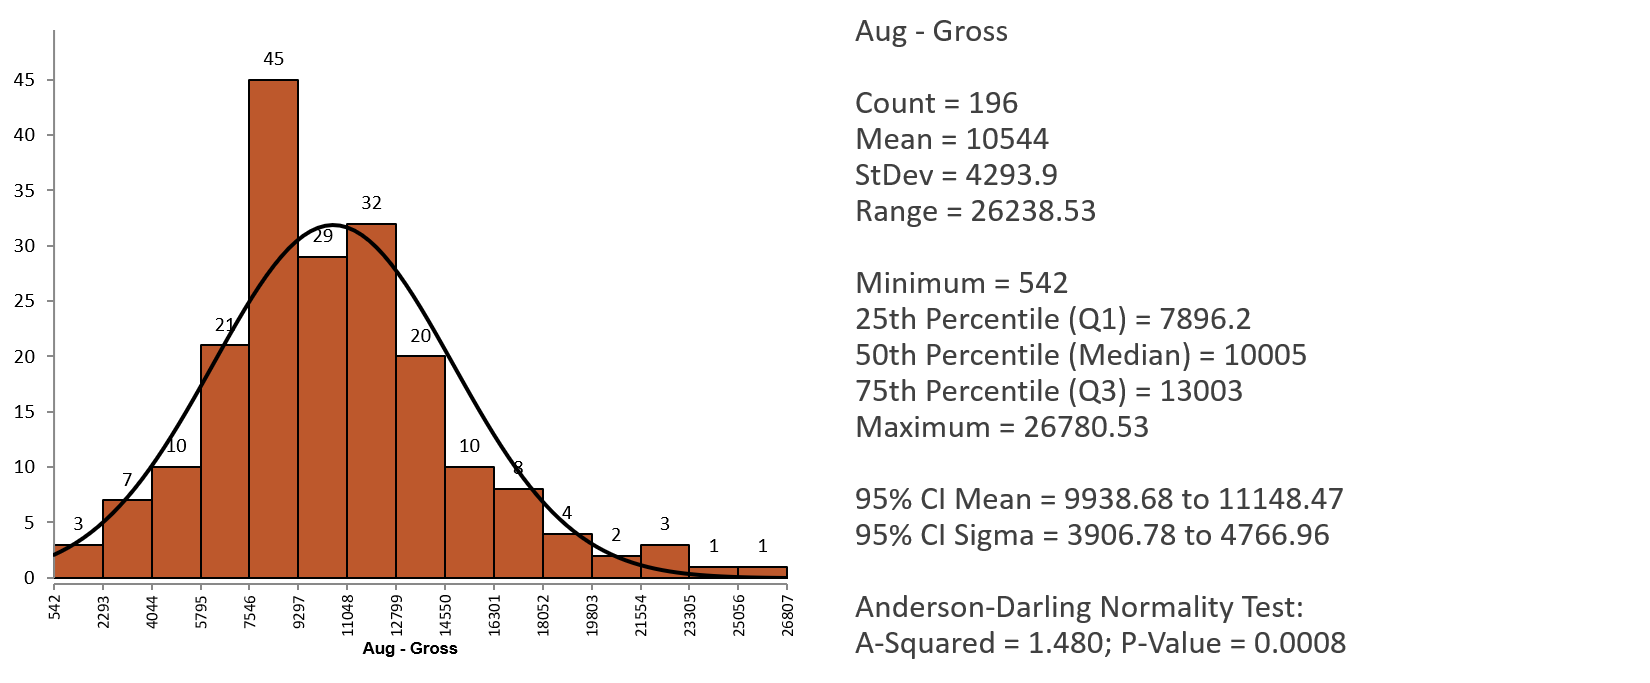
Basic statistical analysis of the data on gross income (including deductions e.g. leaves on loss of pay etc). Data looks normally distributed. Average gross income is around Rs.10,000. 75% of the population earn equal to or more than Rs. 7896. 25% of of the population earn more than Rs.13,000.

Correlation and regression analysis
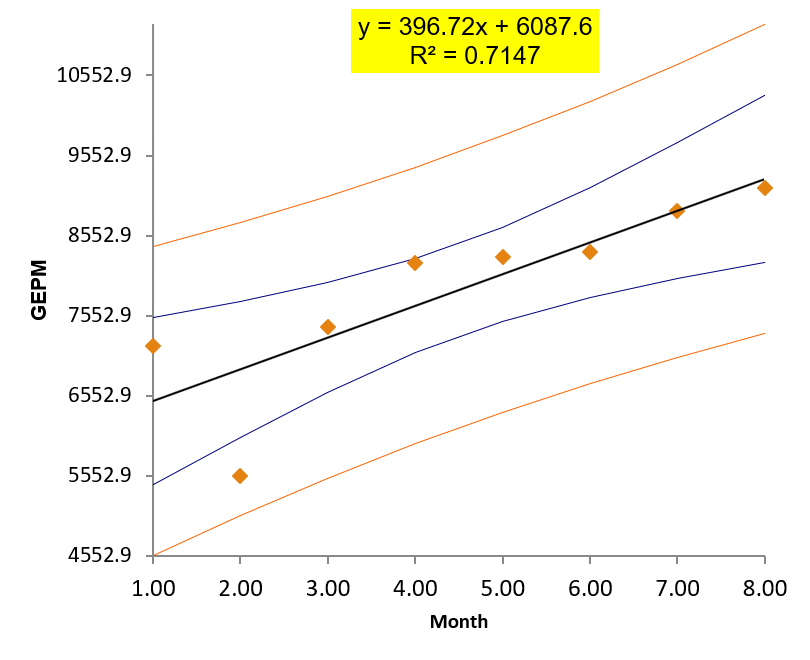
Is there a correlation between, tenure and gross income? Can we predict a new hire’s income based on tenure? Data for eight months reveals a r-square value of 0.71, meaning, there is a significant correlation between the two! Simple linear regression equation fitted between the two suggests, Rs.6087 is the minimum anyone can earn – regardless of performance. As the tenure progresses, gross earning per month (GEPM) increases.

Practical inference
Mean income per worker is impressive! Who says, you don’t pay well? With an average pay of Rs.10,000 per month, free accommodation, subsidized food, free evening snack and tea, flexible hours to finish the production target after 6:30 pm till 9:00 pm.. amazing combination! Who is offering these around this place? – None.
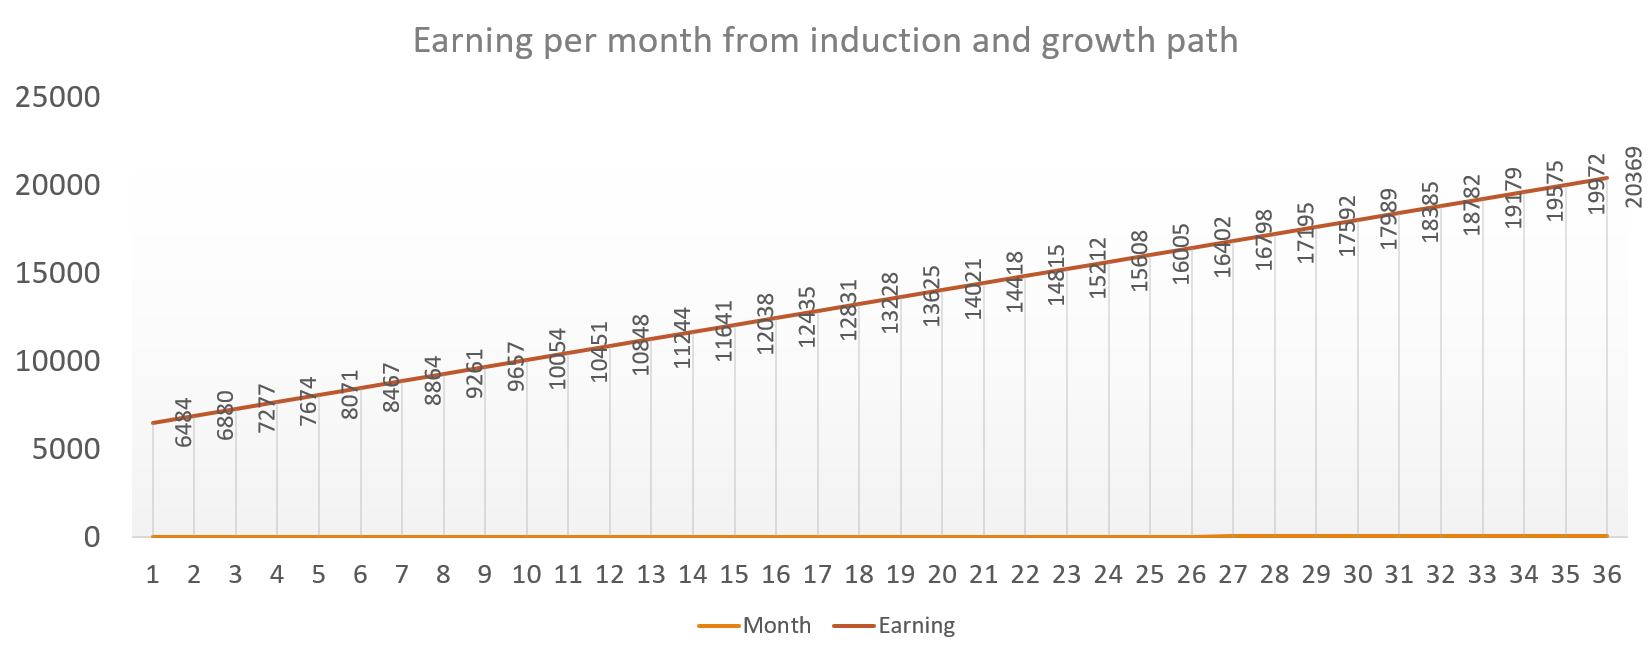
From the regression analysis, fitted growth curve in gross income per month is shown below:

Are you kidding me? – A NEW HIRE’S GROSS EARNING PER MONTH PROGRESSES LIKE THIS !!?
Oh my gosh! You (your company) grossly underestimated yourselves, what a terrific growth curve you offer… what attrition !!!? People should be fighting to get in, and get hired, everyday in front of your factory. You know now, what you have to offer the ‘new hires’, go get them, and tell the ones you already have, they have a bright future here, if they commit and continue to work.
