
Most plants don’t have a Lean Six Sigma problem.
They have a starting point problem.
You already have dashboards, Kaizen boards, and certified teams.
And yet:
Line 4 still drops output every Tuesday.
Changeovers vary by shift.
Downtime comes back after every “fix.”
That’s not a capability gap.
That’s because you’re solving what is visible, not what is costing you.
What It Actually Feels Like on the Shop Floor
Your best engineers didn’t join to update trackers.
But today, they are:
- Chasing recurring stoppages that were “fixed” last week
- Sitting in review meetings explaining yesterday’s numbers
- Acting as coordinators between production and maintenance
Meanwhile, the same patterns repeat:
A filler stops multiple times a shift — but gets reset so quickly it never shows up in reports.
A changeover that should take 45 minutes quietly stretches to 70 minutes on one shift.
Operators slow down machines to “keep things stable,” but no one logs the lost speed.
And the worst part?
Everything looks fine on paper.
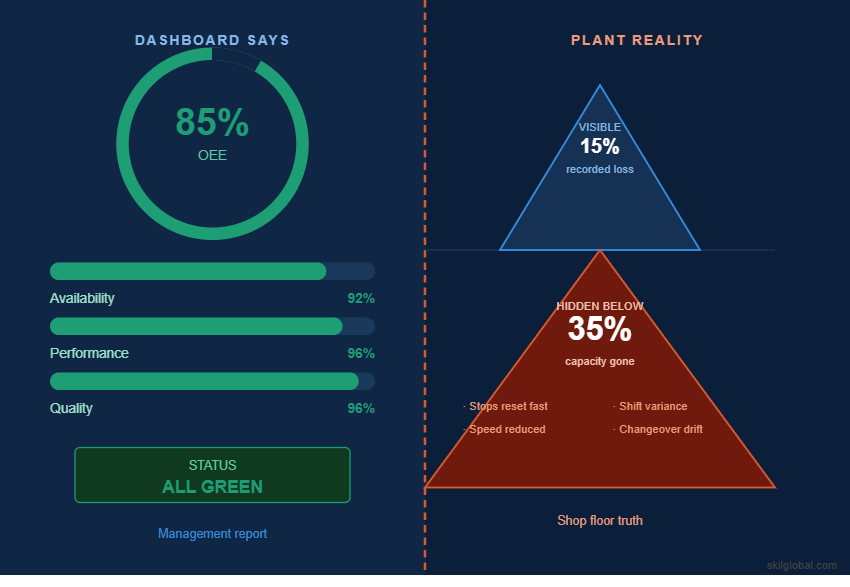
This is where most plants fall into OEE theater —
numbers look green on the dashboard, but output tells a different story.
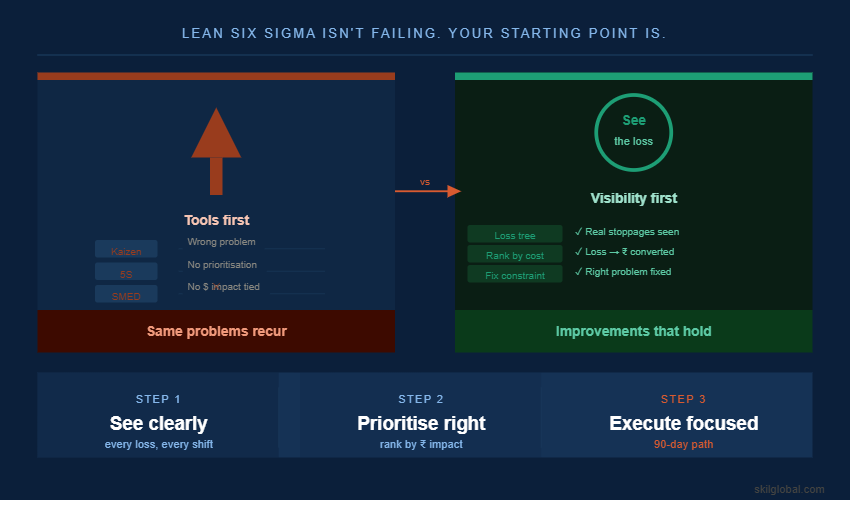
Why Lean Six Sigma Doesn’t Deliver Results
Most improvement programs don’t fail because of tools.
They fail because of where they start.
Typically:
- Projects are selected based on visibility, not impact
- Teams run multiple small improvements without prioritization
- Financial impact is rarely tied back to the shop floor
So you improve something —
just not the constraint that is actually limiting your plant.
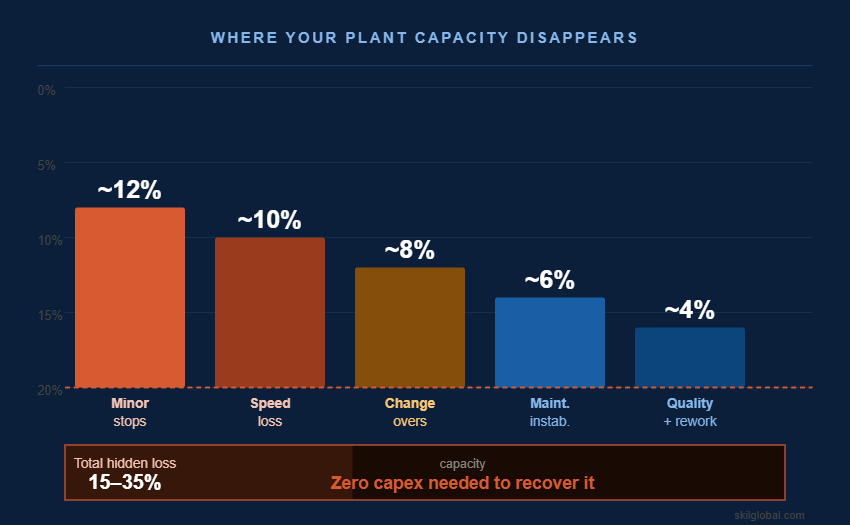
The Real Issue: Losses You Don’t See, You Don’t Fix
In most plants:
- Minor stops are ignored or grouped
- Downtime varies by shift
- Speed losses go unmeasured
- Impact is never converted to money
So decisions are based on partial truth.
As your diagnostic shows, the issue is not performance — it’s visibility.
What a Real Diagnostic Actually Looks Like
This is not an Excel exercise.
It’s not a workshop either.
It’s the kind of assessment where we spend more time in work boots than in the boardroom.
We:
- Stand at the line and observe real stoppages
- Compare shift-to-shift behavior
- Look beyond “machine issues” into patterns operators compensate for
- Track what actually happens between fault and restart
And then convert it into something usable:
A loss tree and a clear waterfall of minutes → output → cost
Because if you can’t see the loss clearly,
you won’t fix the right thing.
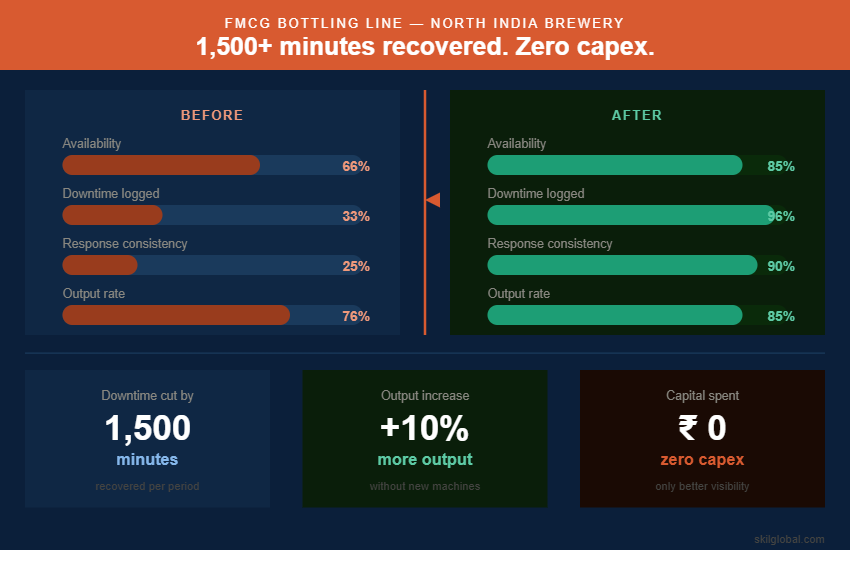
Case Example: FMCG Bottling Line
We walked into a brewery in North India where dashboards showed ~85% availability,
but output told a different story.
They were “ghosting” stops — resetting faults so fast they never got recorded.
What We Saw
- Same fault getting reset repeatedly
- Maintenance response differing by shift
- Downtime inconsistently logged
- Technicians walking across the plant for basic tools
One detail changed everything:
A large part of downtime wasn’t repair —
it was movement and coordination delay.
What Changed
- Tools placed at point of use
- First-response actions standardized
- Clean downtime tracking
- Focused effort on recurring faults
Impact
- Availability improved to ~85%
- 1,500+ minutes of downtime eliminated
- ~10% output increase
- No additional capex
Where Most Plants Are Actually Losing Capacity
Losses don’t sit in one place.
They are spread across:
- Changeovers
- Minor stops and speed loss
- Maintenance instability
- Quality and rework
- Planning gaps
Together, they account for 15–35% capacity loss in most plants.
Before You Start Another Improvement Initiative
Before you fix anything, check where you’re actually losing.
Download the Operational Excellence Self-Assessment
It will quickly show whether your losses are visible,
or just well hidden inside “normal operations.”
Stop Guessing Where Your Output Went
Most plants don’t need more tools.
They need:
- Clear visibility
- Proper prioritization
- Focused execution
If you want to improve manufacturing efficiency and unlock capacity—
start by finding the right problem.
Book a 20-Minute Diagnostic Call
We’ll help you:
- Identify your top 2–3 hidden losses
- Estimate real business impact
- Outline a practical 90-day execution path
No theory.
No generic frameworks.
Just a clear answer to one question:
Where are you actually losing time — and what is it costing you?