Sreedher Kadambi and Badri Narayana, Flame TAO Knoware Pvt. Ltd.
Our previous articles covered the initial phases of our Six Sigma DMAIC implementation journey for enhancing embroidery quality. These include the ‘defining’, ‘measuring’, and ‘analysis’ stages of the Six Sigma process in our associated apparel company. Here, we’ll continue to explore the fourth phase of the DMAIC project – to improve the process!
Improve: To Implement Countermeasures and Improve the Process
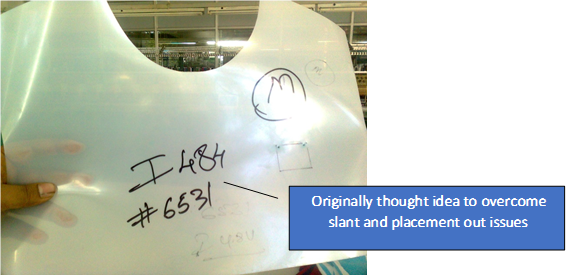
To work on the ‘improve’ phase, our team interacted with the pattern masters over the weekend. Thereafter, they used Teflon sheets (figure 1) to design pattern papers. However, there was one thing that the team forgot – to consider the cost of the long-term implementation of this idea. As Teflon sheets were a lot costlier than the average pattern-making paper, the team decided to modify the pattern sheet’s design (figure 2). Specifically, the area in which the marking should have been done would now be kept transparent. Therefore, the requirement for the Teflon sheets was minimized – thereby making it more affordable.

Figure 1 – Version 1 of the improvement idea

Figure 2 – Revised improvement idea
To improve the condition of the stains, our team followed the 3rd S of the 5S principles – i.e., shine. Consequently, the following measures were carried out (figure 3):
- Firstly, the operators were to use white gloves. This was made mandatory when dealing with white fabric.
- Secondly, the garments were to be wrapped in polythene covers while being stored in racks.
- Thirdly, the workers had to maintain only an hour’s worth of inventory near the marking station. Thereafter, they would be procured in JIT.

Figure 3 – Preventing garments from becoming stained
Therefore, the team implemented these countermeasures to tackle the issues. Most importantly, we successfully encouraged the entire embroidery department’s participation in this process. Without this collective effort, the steps would be futile.
The most significant objective of countermeasures is to evaluate their efficacy. If it fails, we need to ask ourselves why? However, if it’s successful, we’ll also need to evaluate whether it’s producing the desired results. Therefore, a before-and-after comparison with numbers will help here. The bar graph in figure 4 shows our comparison and indicates a significant reduction in defect frequencies. Above all, remember to be open to modifying countermeasures based on the pilot runs and feedback!

Figure 4 – Comparison of frequency of defects after implementing countermeasures
Figure 4 tells us the following things about our implementation of the countermeasures:
- Firstly, there’s a significant reduction in the frequency of defects (design slant).
- Secondly, the placement out defect was also eliminated!
- Thirdly, the stains were also eradicated, which proves that the countermeasures worked!
- Lastly, we observed a significant reduction in broken stitches.
Now that we’ve understood the ‘improvement’ phase of the DMAIC project, let’s take a look at the next one.
